本文主要介绍如何使用golang自带的工具剖析程序性能瓶颈。
声明
主要代码来自Dave Cheney,原博文对应的代码在这里。
示例代码
本文为了展示方便,对部分代码作了一点调整,统一放在这里。
前置准备
- 安装新版本go
- 安装chrome
- 安装graphviz
benchmark
用testing包测试程序的benchmark,比较简单不多说。
1
2
3
4
5
|
func BenchmarkFib20(b *testing.B) {
	for n := 0; n < b.N; n++ {
		Fib(20) // run the Fib function b.N times
	}
}
|
执行benchmark测试:
pprof
cpu
使用profile.CPUProfile收集cpu使用情况:
1
2
3
4
5
6
7
|
import "github.com/pkg/profile"

func main() {
    defer profile.Start(profile.CPUProfile, profile.ProfilePath(".")).Stop()

    // ...
}
|
编译、运行后会在当前目录下生成cpu.pprof,用自带的pprof工具查看:
1
2
3
4
5
6
|
go build

# 统计moby.txt有多少单词
./words ../books/moby.txt

go tool pprof -http=:8080 cpu.pprof
|
可以看到syscall read占据了绝大部分时间:
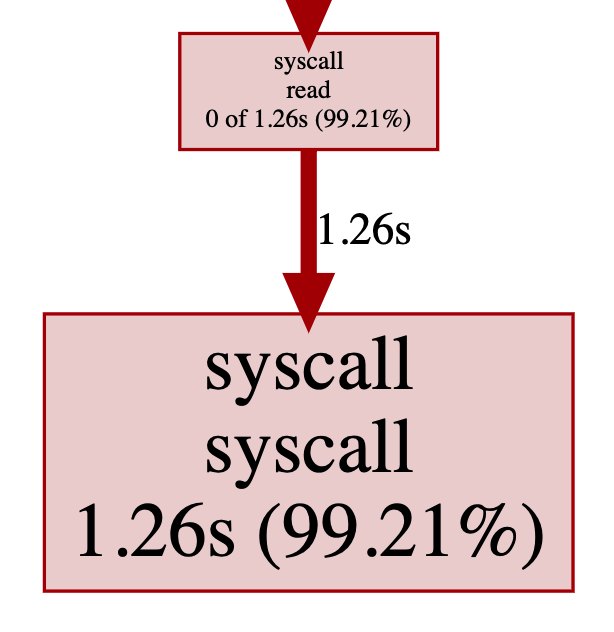
查看源码就知道,readbyte每次只读1个字节,每次都触发syscall read。
比较自然的优化方案就是每次syscall多读一些并且缓存起来,使用bufio.NewReader即可实现。
1
2
3
4
5
6
|
b := bufio.NewReader(f)
// ...
for {
    r, err := readbyte(b)
    // ...
}
|
改完再继续分析,发现修改有效,大部分时间耗费在了mallocgc。
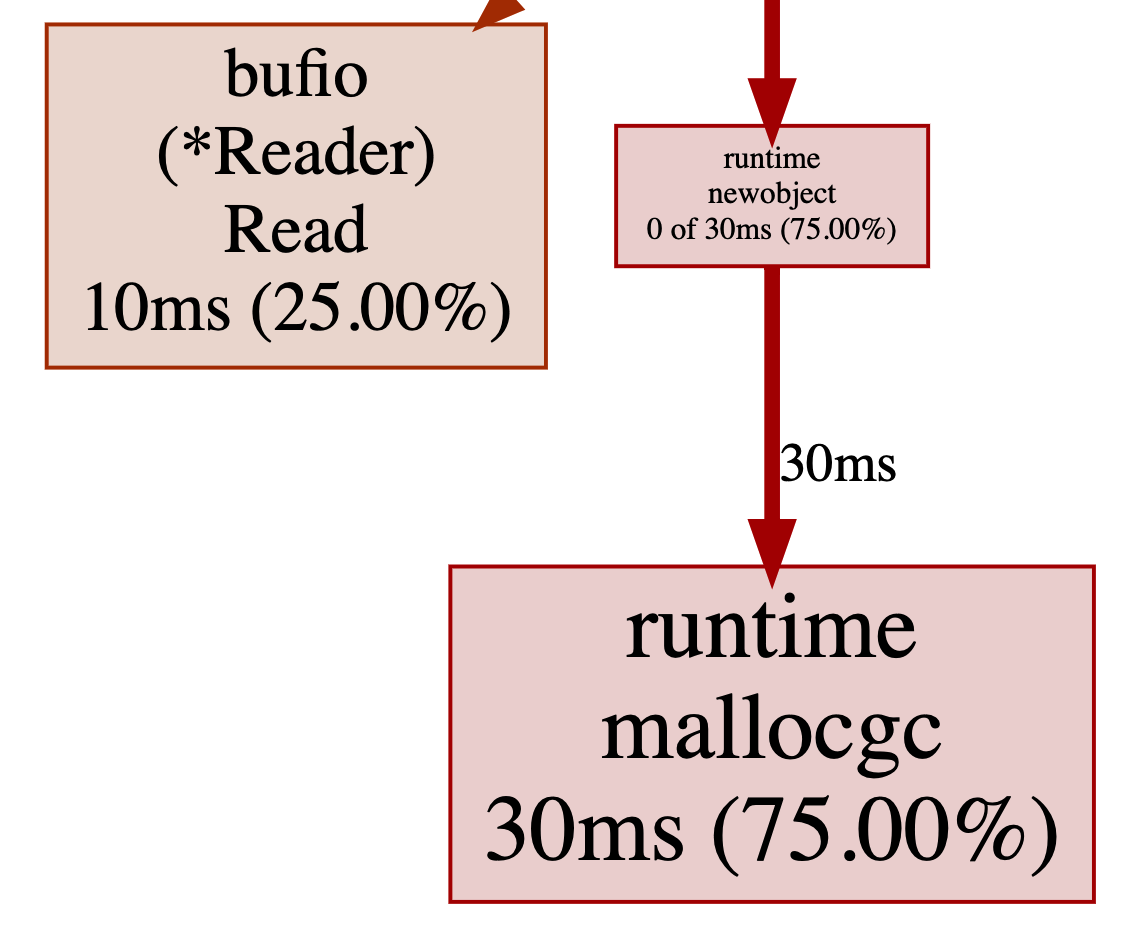
这个表明时间耗费在了创建新对象时的内存分配,我们继续使用pprof分析内存(见下一小节)。
memory
使用profile.MemProfile收集内存使用情况:
1
2
3
4
5
6
7
|
import "github.com/pkg/profile"

func main() {
    defer profile.Start(profile.MemProfile, profile.ProfilePath(".")).Stop()

    // ...
}
|
编译、运行后会在当前目录下生成mem.pprof,继续使用pprof工具查看:
1
2
3
4
5
6
|
go build

# 统计moby.txt有多少单词
./words ../books/moby.txt

go tool pprof -http=:8080 mem.pprof
|
很明显readbyte又是罪魁祸首:
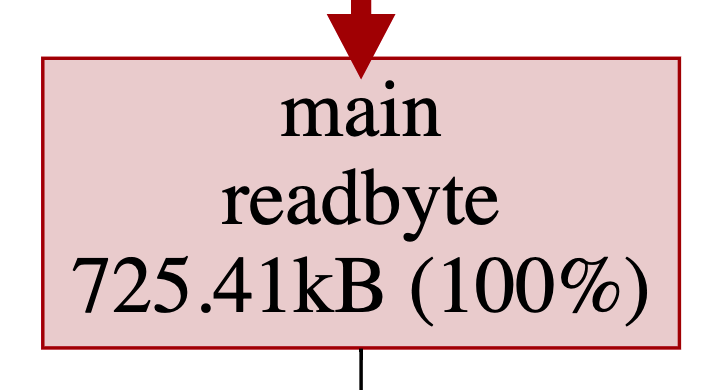
这里涉及到golang的逃逸分析,感兴趣的看这里。
 1
 2
 3
 4
 5
 6
 7
 8
 9
10
|
./main.go:15:6: buf escapes to heap:
./main.go:15:6:   flow: {heap} = &buf:
./main.go:15:6:     from buf (address-of) at ./main.go:16:22
./main.go:15:6:     from buf[:] (slice) at ./main.go:16:22
./main.go:15:6:     from r.Read(buf[:]) (call parameter) at ./main.go:16:18
./main.go:14:15: parameter r leaks to {heap} with derefs=0:
./main.go:14:15:   flow: {heap} = r:
./main.go:14:15:     from r.Read(buf[:]) (call parameter) at ./main.go:16:18
./main.go:14:15: leaking param: r
./main.go:15:6: moved to heap: buf
|
简单来说就是接口方法调用引用了buf变量,导致buf改为在堆上分配内存。
这里不讨论为什么不能分配在栈上,集中注意力在如何优化上面。
既然分配耗费时间,是否可以减少分配操作?
其实readbyte使用的buf分配一次即可,后续可以复用。
 1
 2
 3
 4
 5
 6
 7
 8
 9
10
11
12
13
14
15
16
17
18
19
|
type bytereader struct {
	buf [1]byte
	r   io.Reader
}

func (b *bytereader) next() (rune, error) {
	_, err := b.r.Read(b.buf[:])
	return rune(b.buf[0]), err
}

// 分配一次
br := bytereader{
	r: bufio.NewReader(f),
}

for {
    r, err := br.next()
    // ...
}
|
修改完之后通过time测量发现,程序已经跟wc -w速度差不多了🎉。
trace
统计单个文件已经满足不了words了,火速加上统计指定文件夹内txt文件单词数的功能。
速度一般般,cpu和内存剖析看了也符合预期。不过可以更快一点吗?
这个时候就轮到大杀器trace上场了。
1
2
3
4
5
6
7
|
import "github.com/pkg/profile"

func main() {
    defer profile.Start(profile.TraceProfile, profile.ProfilePath(".")).Stop()

    // ...
}
|
编译、运行后会在当前目录下生成trace.out,这次使用trace工具查看:
1
2
3
4
5
|
go build

./words ../books

go tool trace -http=:8080 trace.out
|
不同于pprof基于采样,trace集成在runtime中,提供毫秒级别的时序执行记录。
trace记录的信息更多(对程序性能影响也更大),基本上每个时间点程序发生了什么都能准确知道。
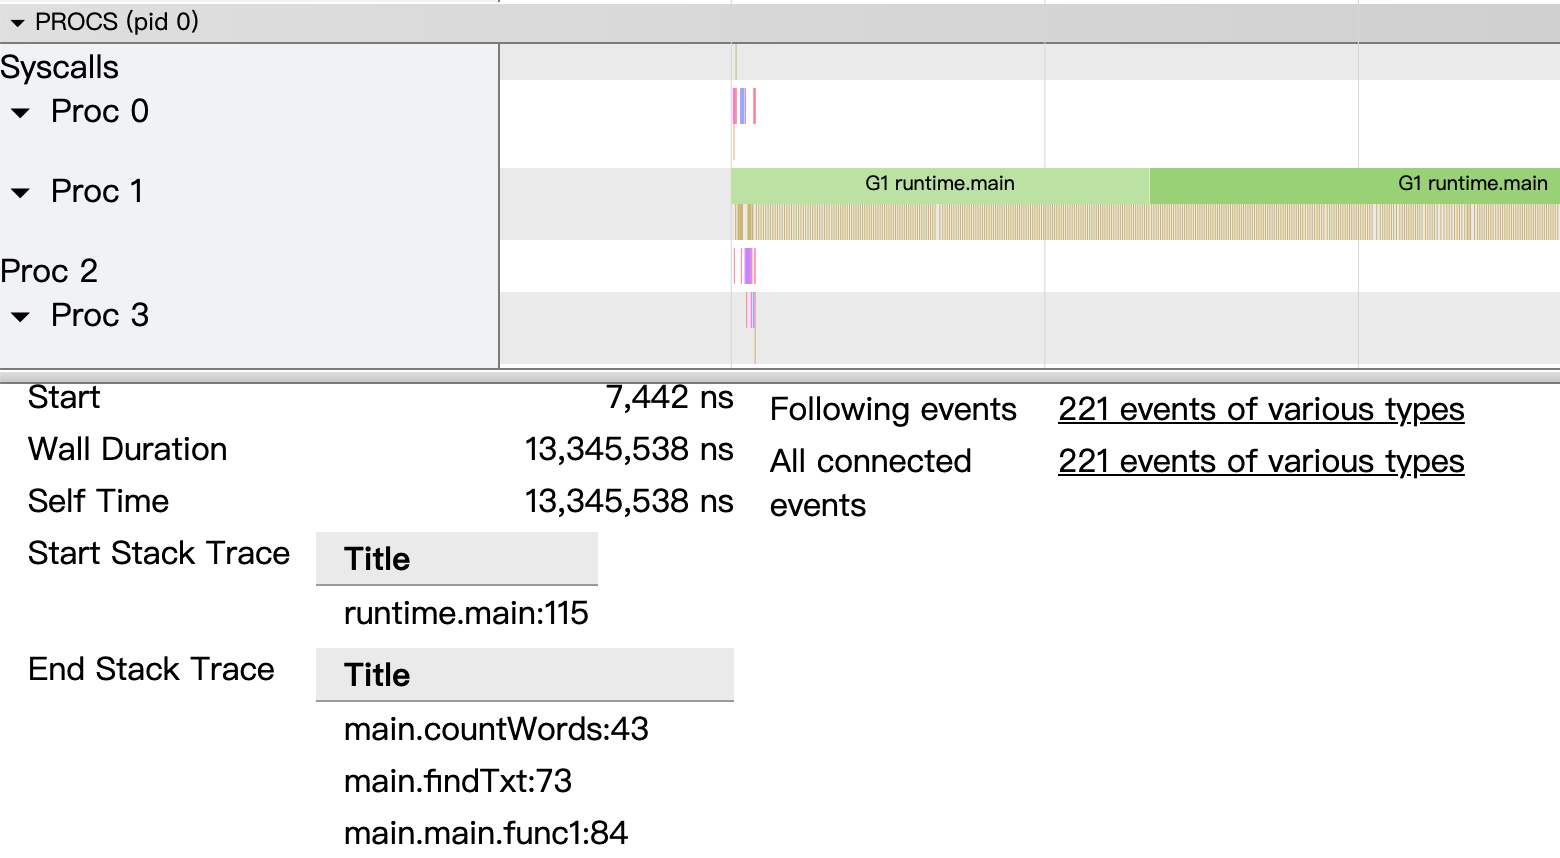
从图中可以看到,程序一直在忙着执行代码,但是只有一个协程在忙!
竟然忘记了golang最有力的武器goroutine,赶紧加上~ go countWords~
http pprof && trace
在开发多协程版words同时,另外一名同事已经上线了words服务(天知道谁会使用~)。
同样的,words也有性能问题,但是应该怎么分析?
对于线上运行的服务,我们可以通过net/http/pprof包来pprof和trace程序。
 1
 2
 3
 4
 5
 6
 7
 8
 9
10
11
12
13
14
15
16
17
18
19
20
21
22
23
24
25
26
27
28
29
30
31
32
33
34
35
36
|
import _ "net/http/pprof"

func startTrace(w http.ResponseWriter, r *http.Request) {
	f, err := os.Create("trace.out")
	if err != nil {
		fmt.Fprintln(w, "Failed to create trace file")
		return
	}

	err = trace.Start(f)
	if err != nil {
		fmt.Fprintln(w, "Failed to start trace:", err)
		return
	}

	fmt.Fprintln(w, "Trace started")
}

func stopTrace(w http.ResponseWriter, r *http.Request) {
	trace.Stop()
	fmt.Fprintln(w, "Trace stopped")
}

func serveDebug(stop <-chan struct{}) error {
	mux := http.DefaultServeMux

	// 方法一:
	// http://127.0.0.1:8081/start
	// http://127.0.0.1:8081/stop
	mux.HandleFunc("/start", startTrace)
	mux.HandleFunc("/stop", stopTrace)
	// 方法二:
	// curl -o trace.out http://127.0.0.1:8081/debug/pprof/trace?seconds=5

	return serve("127.0.0.1:8081", mux, stop)
}
|
import完、启动监听服务之后就可以了:
方法一
手动访问127.0.0.1:8081/start和127.0.0.1:8081/stop开始和停止trace,生成trace.out文件。
方法二
1
|
curl -o trace.out http://127.0.0.1:8081/debug/pprof/trace?seconds=10
|
拿到trace.out之后就可以按照之前的步骤分析了。
后记
There are only three optimizations: Do less. Do it less often. Do it faster.
The largest gains come from 1, but we spend all our time on 3. – Michael Fromberger
其实官方的Profiling Go Programs也是不错的,不过示例代码比较复杂,注意力更多集中在了代码逻辑。
参考资料
